Demo
Simulation of traffic in Querétaro city
Follow this link to open a dashboard built with the Dash framework and Dash Sylvereye. The dashboard displays a SUMO simulation of vehicle traffic in downtown Querétaro.
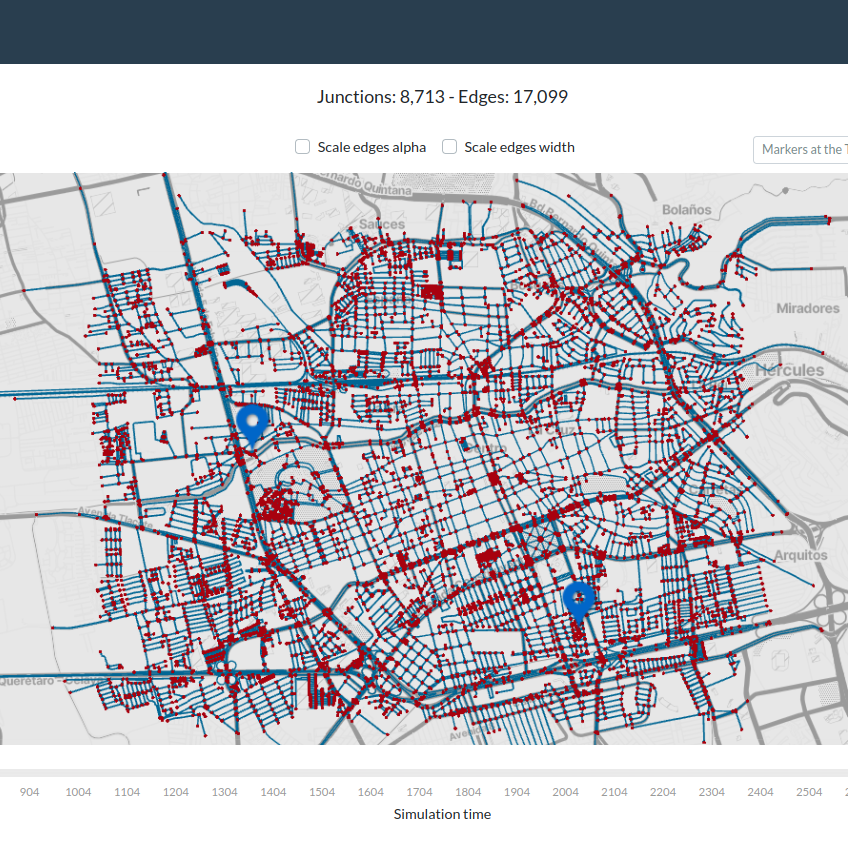
The dashboard features a Dash Sylvereye visualization as its centerpiece. A checklist lets users toggle the visible layers and choose whether markers appear at the centers of the busiest edges or on top of the slowest vehicles. Another checklist controls visual properties of the edges, such as transparency and width relative to vehicle count. A slider selects which simulation timestamp is displayed.
For details about the simulation data and the inner workings of the dashboard, see the Dash Sylvereye paper.